From discussions with people, along with paying attention to search terms used to research this article, I have noticed that there are several frequently asked questions related to histograms. If you have further questions, feel free to contact me and suggest additions to this list.
In short, a histogram is a type of graph that counts the number of things present. For example, in an image or photograph, histograms are commonly used to count the number of pixels of different values that are present in the photograph. Basically, a histogram shows the distribution of pixel values present in the photograph.
In addition to showing the distribution of pixel values as mentioned above, a histogram will quickly allow a photographer to assess if a photograph is too dark or too light (even if the LCD on the camera is hard to see in the field). Histograms will also help a photographer understand if a photograph is using most of or only a portion of the dynamic range available. Functions can also performed on a photograph's histogram, such as using the curves filter in Adobe Photoshop, to manipulate the values of the photograph in various ways, such as saturation/desaturation, posterization, inverting pixel values, and many others. Section 4 discusses such manipulations.
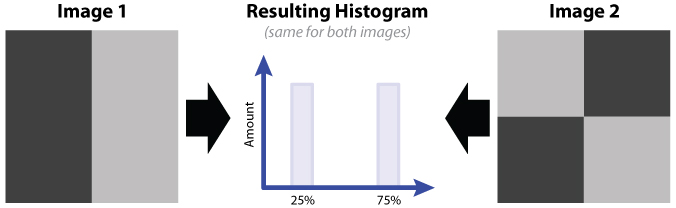
Yes. The high-level reason that two or more images can have the same histogram is because a histogram does not communicate the structure of an image. Rather, a histogram only shows the distribution of pixel values within a given image. For example, the images below will have the same histogram, even though the images themselves are different. In particlar, both images have the same number of light gray and dark gray pixels. Section 2 discusses this particular subject in greater detail.
Any comments or suggestions should be sent to [ comments at davidkunzman.net ]. Unless noted
otherwise, the artwork, photographs, articles, and blog posts presented on this website, along
with the general website design are copyrighted by David Kunzman. ©2010-2026 David Kunzman. All rights reserved. Facebook, Twitter, and other logos (and
icons, buttons, etc.) are trademarked and/or copyrighted by their respective owners. Social
media icons are copyrighted by and were downloaded from IconShock.com ![]() . RSS feed
icons are copyrighted by and were downloaded from Feed Icon Guidelines
. RSS feed
icons are copyrighted by and were downloaded from Feed Icon Guidelines ![]() .
.
Page generated Friday, July 31st, 2026 at 10:24 -0700 GMT